Graphing Practice
|
|
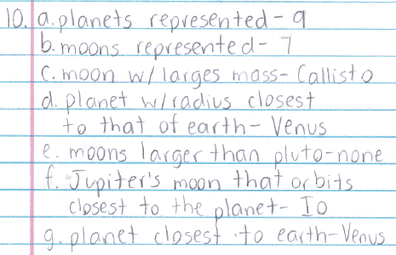
Problem 1
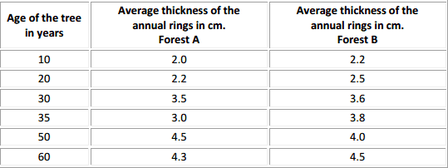
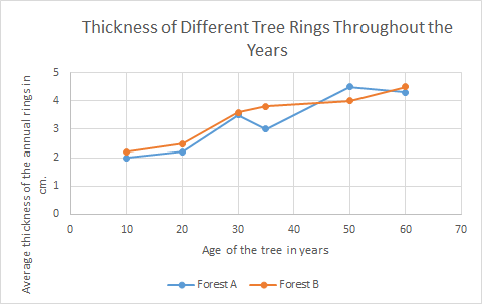
A. Make a line graph of the data.
B. What is the dependent variable? Age of the Tree in Years C. What is the independent variable? Average Thickness of the Annual Rings D. What was the average thickness of the annual rings of 40 year old trees in Forest A? 3.5 cm. E. Based on this data, what can you conclude about Forest A and Forest B? The growth of the annual rings is similar throughout the years |
|
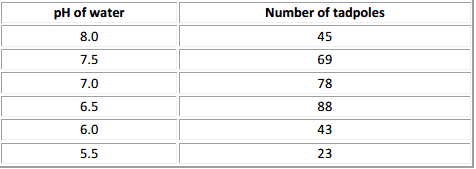
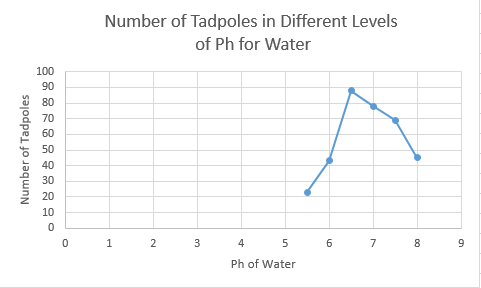
Problem 2
A. Make a line graph of the data.
B. What is the dependent variable? the number of tadpoles C. What is the independent variable? Ph of water D. What is the average pH in this experiment? 6.75 E. What is the average number of tadpoles per sample? 57.66 F. What is the optimum water pH for tadpole development? 6.5 G. Between what two pH readings is there the greatest change in tadpole number? between 6 and 6.5 H. How many tadpoles would you expect to find in water with a pH reading of 5.0? about 15 |
|
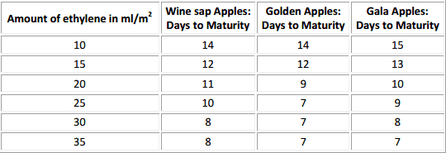
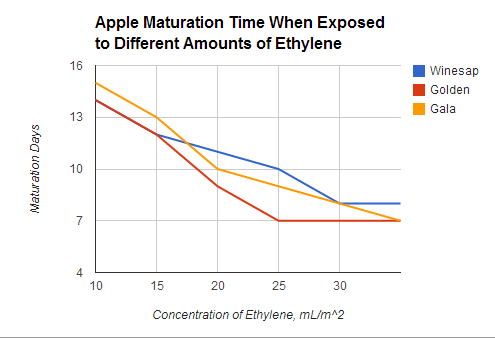
Problem 3
A. Make a line graph of the data.
B. What is the dependent variable? Concentration of Ethylene C. What is the independent variable? The Number of Days the Apples Take to Mature |
|
